Description
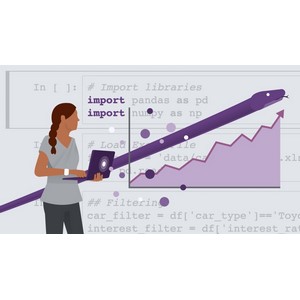
Python for Data Visualization Course. This course teaches you how to design accurate and effective charts and graphs using the Python programming language and its specialized libraries. Data visualization is essential for data scientists, as it allows them to present their findings in an understandable way. This course shows that even without design expertise, you can create expressive and professional visualizations using libraries like pandas and Matplotlib. Throughout the course, you will learn the steps to load and clean data and create a variety of charts, including histograms, heat maps, and multi-slice charts. Instructor Michael Galarnick provides step-by-step instruction to prepare you to create high-quality data visualizations. This course is suitable for those who want to visually and effectively display their data using Python.
What you will learn:
- Effectively Presenting Data with Python
- Introduction to Jupyter Notebooks
- Using the pandas library for data analysis (creating, loading, basic operations, slicing, filtering and cleaning data, renaming and deleting columns, aggregate functions, identifying and handling missing data, converting and exporting DataFrames)
- Simplifying visualization with Matplotlib (Matplotlib basics, setting marker type and colors, MATLAB-style syntax vs. object, setting titles, labels, and ranges, adding grids, creating legends, saving plots to files, creating plots with Matplotlib wrappers)
- Customizing visualizations with Matplotlib (creating heatmaps, histograms, and subplots)
Who is this course suitable for?
- Data scientists who want to improve their data visualization skills.
- Analysts who need to present their findings in a visually appealing way.
- Developers who want to integrate charts and graphs into their Python programs.
- Anyone interested in learning how to visualize data using Python.
Python for Data Visualization Course Specifications
- Publisher: LinkedIn
- Instructor: Madecraft , Michael Galarnyk
- Education level: Intermediate
- Training duration: 1 hour and 21 minutes
Course headings

Course images

Sample course video
Installation Guide
After Extract, view with your favorite player.
Subtitles: English
Quality: 720p
Download link
File size
166 MB


